- Register
- Sign In
- Agent Emailvishav@vishavbrar.com
- Agent Phone+1(604) 754-8242
Find Your Perfect Place, Effortlessly!
Most Updated MLS Listings.
- 1/39 392 Beds 2 Baths 848 SqFt$599,999Open Sun 12PM-2PM
- 1/26 262 Beds 2 Baths 1,077 SqFt$599,000Open Sat 2:30PM-4:30PM
- 1/18 182 Beds 1 Bath 655 SqFt$499,000Open Sat 2PM-4PM
- 1/16 162 Beds 2 Baths 818 SqFt$599,000Open Sat 1PM-4PM
- 1/18 182 Beds 2 Baths 953 SqFt$599,000Open Sat 2PM-4PM
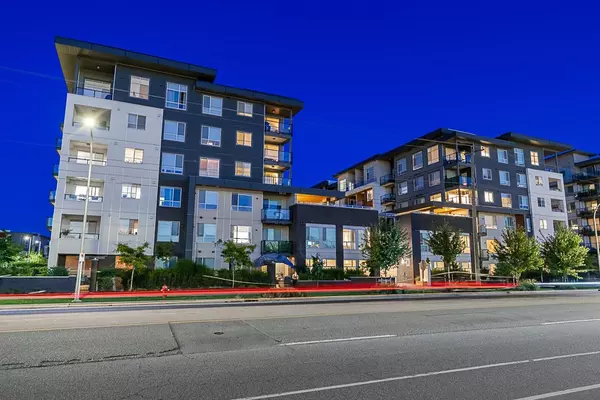
9983 E BARNSTON DR #210, Surrey, BC V4N 6T3
MLS# R2942941
Listed by eXp Realty of Canada, Inc.
Condo
- 3D2 Beds 1 Bath 510 SqFt$449,000Open Sat 2PM-4PM
- 1/25 258 Beds 6 Baths 3,788 SqFt$1,850,000Open Sat 2PM-4PM
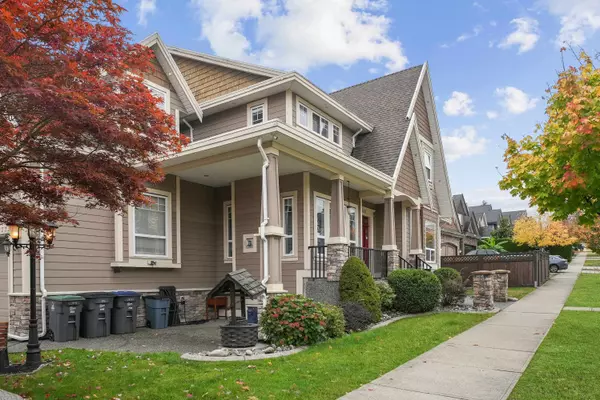
16785 58B AVE, Surrey, BC V3S 2K3
MLS# R2942240
Listed by eXp Realty of Canada, Inc.
Single Family Home
- 1/37 3711 Beds 7 Baths 5,536 SqFt$1,849,800New
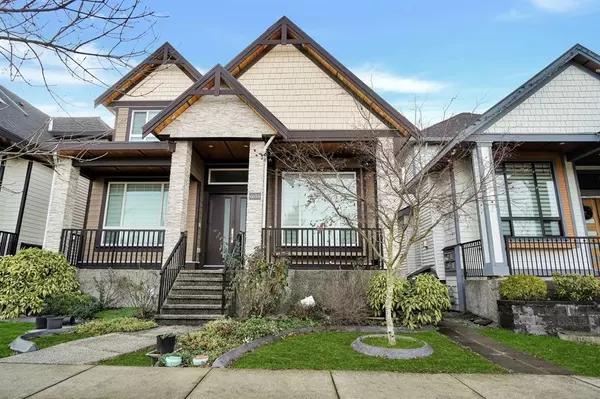
14333 68 AVE, Surrey, BC V3W 2H5
MLS# R2945530
Listed by Century 21 Coastal Realty Ltd.
Single Family Home
- 1/29 298 Beds 6 Baths 4,308 SqFt$1,999,000New
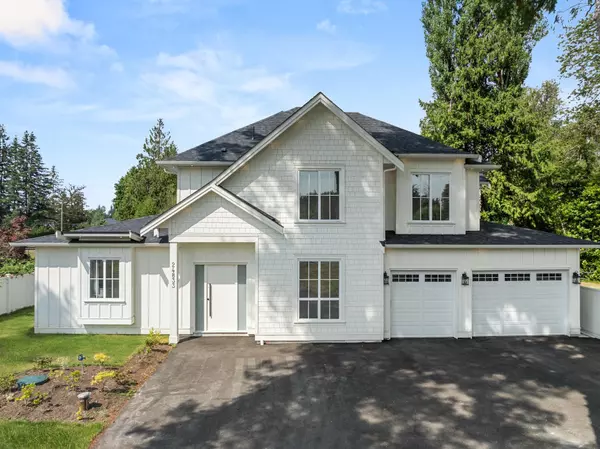
14867 67A AVE, Surrey, BC V3S 0P3
MLS# R2945587
Listed by Keller Williams Ocean Realty
Single Family Home
- 1/40 406 Beds 5 Baths 3,621 SqFt$1,599,888New
8746 208 ST, Langley, BC V1M 2Y3
MLS# R2944794
Listed by Royal LePage - Wolstencroft
Single Family Home
- 1/25 257 Beds 7 Baths 4,138 SqFt$1,999,800New
9717 182 ST, Surrey, BC V4N 4J9
MLS# R2944525
Listed by RE/MAX Performance Realty
Single Family Home
- 1/25 257 Beds 6 Baths 4,558 SqFt$1,989,879Active
5997 137A ST, Surrey, BC V3X 3N6
MLS# R2943268
Listed by Royal LePage Global Force Realty
Single Family Home
Get Your Home Valuation Report For Free!
Find your home's value in today's market!
BLOG POSTS
Fraser Valley Monthly Statistics Package July 2024
Cool summer market persists in Fraser Valley with second slowest July sales in a decade SURREY, BC — Sluggish seasonally-adjusted sales and a continued rise in inventory has the Fraser Valley market slowly shifting to favour buyers. The Fraser Valley Real Estate Board recorded 1,230 sales in July, down by seven per cent over last month and down by 26 per cent over the 10-year seasonal average. Inventory levels in the Fraser Valley reached a 10-year seasonally adjusted high in July with active listings at 8,731, up 5 per cent over June and 41 per cent higher than July 2023. New listings were flat in July, down by less than half a per cent from June, to 3,412. With a sales-to-active listings ratio of 14 per cent, overall market conditions are balanced. The market is considered balanced when the ratio is between 12 per cent and 20 per cent. “Despite back-to-back policy rate cuts by the Bank of Canada, many first-time homebuyers are still facing challenging market conditions — high interest rates, the mortgage stress test and the need for a substantial down payment,” said FVREB CEO, Baldev Gill. “While we wait for the rate cuts to take effect, we encourage anyone looking to buy or sell to speak with a professional REALTOR®, who has the knowledge and expertise to navigate the current market.” MLS® HPI Benchmark Price Activity Single Family Detached: At $1,529,600, the Benchmark price for an FVREB single-family detached home increased 0.1 per cent compared to June 2024 and decreased 0.5 per cent compared to July 2023. Townhomes: At $848,800, the Benchmark price for an FVREB townhome decreased 0.3 per cent compared to June 2024 and decreased 0.1 per cent compared to July 2023. Apartments: At $551,000, the Benchmark price for an FVREB apartment/condo remained flat compared to June 2024 and decreased 0.3 per cent compared to July 2023.
Fraser Valley Monthly Statistics Package April 2024
DOWNLOAD FULL STATS PACKAGE HERE Last month, the supply of available homes in the Fraser Valley market continued to grow, yet buyers remained relatively cautious, resulting in a more subdued resale market in April. The Fraser Valley Real Estate Board documented 1,471 transactions on its Multiple Listings Service® (MLS®) in April, marking a 5 percent increase from March but a 5 percent decline compared to April 2023. Despite being the third-lowest recorded for an April in the last decade, sales remained tepid while inventory continued to expand, reaching levels unseen since September 2020. Active listings reached 7,313, surging by 18 percent over the previous month and standing 17 percent above the 10-year average. “We are seeing a relatively calm and balanced market right now,” said Jeff Chadha, Chair of the Fraser Valley Real Estate Board. “Which means buyers have time to shop around and purchase a home without the pressure of a few years ago, and while prices are holding fairly steady across all property types.” The influx of new listings contributed to the overall growth in inventory, soaring by 33 percent in April to 3,976. With a sales-to-active listings ratio of 20 percent, the market conditions overall are deemed balanced, falling within the range of 12 to 20 percent indicating equilibrium. "There's a notable sense of caution prevailing in the market at present," remarked FVREB CEO Baldev Gill. "Buyers are exhibiting hesitancy in committing to home purchases until there's a potential reduction in the Bank of Canada's rate. Nevertheless, we encourage anyone considering entering the market to consult their REALTOR® and financial advisor to explore the current rate landscape." The average number of days homes spend on the market continued to decrease, with single-family detached homes averaging 23 days (down from 27 in March), apartments at 23 days (down from 26 in March), and townhomes moving even quicker at 19 days (down from 20 in March). Benchmark prices overall experienced a slight uptick again in April, rising by 0.5 percent from March and up 1.5 percent compared to April 2023. MLS® HPI Benchmark Price Activity: Single Family Detached: With a benchmark price of $1,532,700, FVREB single-family detached homes saw a 1.0 percent increase compared to March 2024 and a 5.3 percent increase compared to April 2023. Townhomes: With a benchmark price of $854,700, FVREB townhomes witnessed a 0.9 percent increase compared to March 2024 and a 4.9 percent increase compared to April 2023. Apartments: With a benchmark price of $561,900, FVREB apartments/condos saw a 1.2 percent increase compared to March 2024 and a 5.7 percent increase compared to April 2023.
Greater Vancouver Monthly Statistics Package April 2024
DOWNLOAD FULL STATS PACKAGE HERE In April, the number of homes actively listed for sale on the MLS® in Metro Vancouver continued to rise, marking a 42 percent increase compared to the previous year and surpassing the 12,000 mark, a level not seen since the summer of 2020. According to Greater Vancouver REALTORS® (GVR), residential sales in the region reached 2,831 in April 2024, showing a 3.3 percent uptick from the 2,741 sales recorded in April 2023. However, this figure was 12.2 percent lower than the 10-year seasonal average of 3,223 sales. "It’s a feat to see inventory finally climb above 12,000. Many were predicting higher inventory levels would materialize quickly when the Bank of Canada began its aggressive rate hikes, but we’re only seeing a steady climb in inventory in the more recent data. The surprise for many market watchers has been the continued strength of demand along with the fact few homeowners have been forced to sell in the face of the highest borrowing costs experienced in over a decade." -Andrew Lis, REBGV director of economics and data analytics In April 2024, there were 7,092 newly listed detached, attached, and apartment properties for sale on the Multiple Listing Service® (MLS®) in Metro Vancouver. This marks a significant 64.7 percent increase compared to the 4,307 properties listed in April 2023, exceeding the 10-year seasonal average by 25.8 percent, standing at 5,637. The total number of properties currently listed for sale on the MLS® system in Metro Vancouver stands at 12,491, indicating a notable 42.1 percent increase compared to April 2023 (8,790), surpassing the 10-year seasonal average by 16.7 percent, set at 10,704. Examining the sales-to-active listings ratio for April 2024 across all property types (detached, attached, and apartments), it sits at 23.5 percent. Breaking down by property type, the ratio stands at 17.6 percent for detached homes, 31.0 percent for attached properties, and 26.0 percent for apartments. Historical data analysis suggests that downward pressure on home prices typically occurs when the ratio remains below 12 percent for an extended period, while upward pressure on prices tends to happen when it exceeds 20 percent over several months. “Another surprising story in the April data is the fact prices continue climbing across most segments with recent increases typically in the range of one to two per cent month-over-month,” Lis said. “The one segment that didn’t see an uptick in prices in April were apartments, which saw a 0.1 per cent decline month-over-month. This moderation is likely due to a confluence of factors impacting this more affordability sensitive segment of the market, particularly the impact of higher mortgage rates and the recent boost to inventory levels, tempering competition somewhat.” Currently, the MLS® Home Price Index composite benchmark price for all residential properties in Metro Vancouver stands at $1,205,800. This reflects a 2.8 percent increase over April 2023 and a 0.8 percent increase compared to March 2024. In April 2024, sales of detached homes reached 814, marking a 0.7 percent increase from the 808 detached sales recorded in April 2023. The benchmark price for a detached home is $2,040,000, showing a 6.3 percent increase from April 2023 and a 1.6 percent increase compared to March 2024. Sales of apartment homes in April 2024 reached 1,416, a 0.2 percent increase compared to the 1,413 sales in April 2023. The benchmark price of an apartment home is $776,500, reflecting a 3.2 percent increase from April 2023 and a 0.1 percent decrease compared to March 2024. Attached home sales in April 2024 totaled 580, indicating a 16 percent increase compared to the 500 sales in April 2023. The benchmark price of a townhouse is $1,127,200, representing a 4.3 percent increase from April 2023 and a 1.3 percent increase compared to March 2024.